I’ve been doing a lot of performance tuning in Riemann recently, especially in the clients–but I’d like to share a particularly spectacular improvement from yesterday.
The Riemann protocol
Riemann’s TCP protocol is really simple. Send a Msg to the server, receive a response Msg. Messages might include some new events for the server, or a query; and a response might include a boolean acknowledgement or a list of events matching the query. The protocol is ordered; messages on a connection are processed in-order and responses sent in-order. Each Message is serialized using Protocol Buffers. To figure out how large each message is, you read a four-byte length header, then read length bytes, and parse that as a Msg.
time --->
send: [length1][msg1]  [length2][msg2]
recv:                     [length1][msg1]  [length2][msg2]
The optimization I discussed last time–pipelining requests–allows a client to send multiple messages before receiving their acknowledgements. There are many queues in between a client saying “send a message” and that message actually being parsed in Riemann: Java IO buffers, the kernel TCP stack, the network card, various pieces of networking hardware, the wires themselves… all act like queues. This means throughput is often limited by latency, so by writing messages asynchronously we can achieve higher throughput with only minor latency costs.
The other optimization I’ve been working on is batching. For various reasons, this kind of protocol performs better when messages are larger. If you can pack 100 events into a message, the server can buffer and parse it in one go, resulting in much higher throughputs at the cost of significantly higher latencies–especially if your event needs to sit in a buffer for a while, waiting for other events to show up so they can be sent in a Msg.
Netty’s threadpools
For any given connection, Netty (as used in Riemann) has two threadpools handling incoming bytes: the IO worker pool, and a handler pool which actually handles Riemann events. The IO worker pool is busy shuttling bytes back and forth from the TCP connection buffers through the pipeline–but if an IO worker spends too much time on a single channel, it won’t be able to handle other channels and latencies will rise. An ExecutionHandler takes over at some point in the pipeline, which uses the handler pool to do long-running work like handling a Msg.
Earlier versions of Riemann put the ExecutionHandler very close to the end of the pipeline, because all the early operations in the pipeline are really fast. The common advice goes, “Wrap long-running tasks in an execution handler, so they don’t block”. OK, makes sense.
(channel-pipeline-factory
           int32-frame-decoder (int32-frame-decoder) ; Read off 32-bit length headers
  ^:shared int32-frame-encoder (int32-frame-encoder) ; Add length header on the way out
  ^:shared protobuf-decoder    (protobuf-decoder)    ; Decode bytes to a Msg
  ^:shared protobuf-encoder    (protobuf-encoder)    ; Encode a Msg to bytes
  ^:shared msg-decoder         (msg-decoder)         ; Convert Msg to a record
  ^:shared msg-encoder         (msg-encoder)         ; Convert a record to a Msg
  ^:shared executor            (execution-handler)   ; Switch to handler threadpool
  ^:shared handler             (gen-tcp-handler      ; Actually process the Msg
                                 core
                                 channel-group
                                 tcp-handler))
Now… a motivated or prescient reader might ask, “How, exactly, does the execution handler get data from an IO thread over to a handler thread?”
It puts it on a queue. Like every good queue it’s bounded–but not by number of items, since some items could be way bigger than others. It’s bounded by memory.
(defn execution-handler
  "Creates a new netty execution handler."
  []
  (ExecutionHandler.
    (OrderedMemoryAwareThreadPoolExecutor.
      16       ; Core pool size
      1048576  ; 1MB per channel queued
      10485760 ; 10MB total queued
      )))
How does the Executor know how much memory is in a given item? It uses a DefaultObjectSizeEstimator, which knows all about Bytes and Channels and Buffers… but absolutely nothing about the decoded Protobuf objects which it’s being asked to enqueue. So the estimator goes and digs into the item’s fields using reflection:
int answer = 8; // Basic overhead.
  for (Class<?> c = clazz; c != null; c = c.getSuperclass()) {
       Field[] fields = c.getDeclaredFields();
       for (Field f : fields) {
           if ((f.getModifiers() & Modifier.STATIC) != 0) {
               // Ignore static fields.
               continue;
           }
           answer += estimateSize(f.getType(), visitedClasses);
Of course, I didn’t know this at the time. Netty is pretty big, and despite extensive documentation it’s not necessarily clear that an OrderedMemoryAwareThreadPoolExecutor is going to try and guess how much memory is in a given object, recursively.
So I’m staring at Yourkit, completely ignorant of everything I’ve just explained, and wondering why the devil DefaultObjectSizeEstimator is taking 38% of Riemann’s CPU time. It takes me ~15 hours of digging through Javadoc and source and blogs and StackOverflow to realize that all I have to do is…
- Build my own ObjectSizeEstimator, or
- Enqueue things I already know the size of.
(channel-pipeline-factory
         int32-frame-decoder (int32-frame-decoder)
^:shared int32-frame-encoder (int32-frame-encoder)
^:shared executor            (execution-handler) ; <--+
^:shared protobuf-decoder    (protobuf-decoder)  ;    |
^:shared protobuf-encoder    (protobuf-encoder)  ;    |
^:shared msg-decoder         (msg-decoder)       ;    |
^:shared msg-encoder         (msg-encoder)       ; ___|
^:shared handler             (gen-tcp-handler
                               core
                               channel-group
                               tcp-handler))
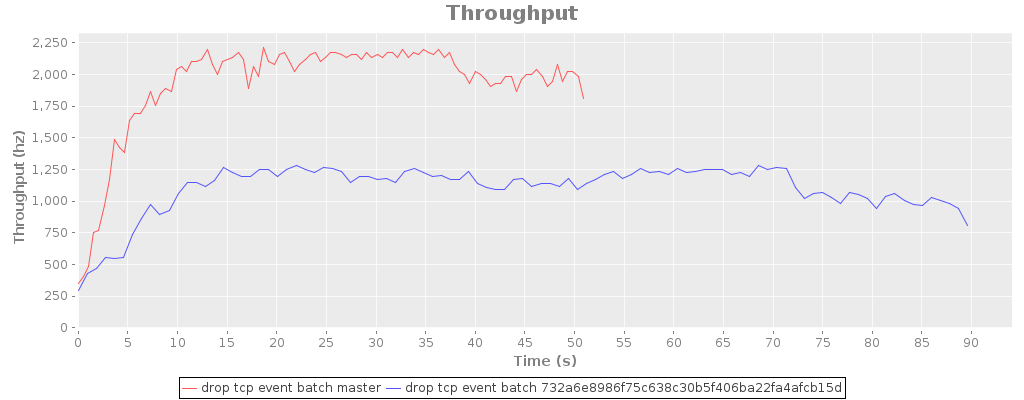
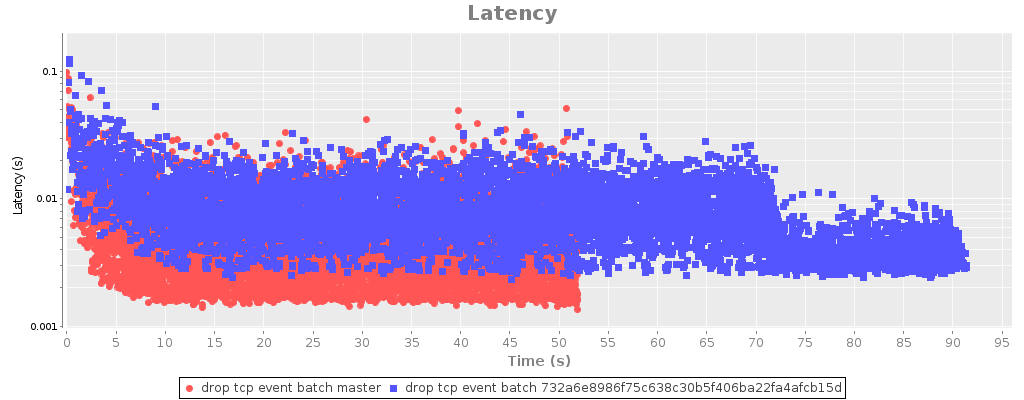
Just move one line. Now I enqueue buffers with known sizes, instead of complex Protobuf objects. DefaultObjectSizeEstimator runs in constant time. Throughput doubles. Minimum latency drops by a factor of two.


Throughput here is measured in messages, each containing 100 events, so master is processing 200,000–215,000 events/sec. Latency is for synchronous calls to client.sendEvents(anEvent). The dropoff at the tail end of the time series is the pipelining client draining its message queue. Client and server are running on the same quad-core Q8300, pushing about 20 megabytes/sec of traffic over loopback. Here’s what the riemann-bench session looks like, if you’re curious.
Why didn’t you figure this out sooner?
I wrote most of this code, and what code I didn’t write, I reviewed and tested. Why did it take me so long to figure out what was going on?
When I started working on this problem, the code looked nothing like the pipeline I showed you earlier.
The Netty pipeline evolved piecemeal, by trial-and-error, and went through several refactorings. The UDP server, TCP server, and Graphite server share much of the same code, but do very different things. I made several changes to improve performance. In making these changes I tried to minimize API disruption–to keep function interfaces the same–which gradually pulled the pipeline into several interacting pieces. Since Netty’s API is well-written, flexible Java code, it comes with literally hundreds of names to keep track of. Keeping function and variable names distinct became a challenge.
By the point I started digging into the problem, I was hard pressed to figure out what a channel pipeline factory was, let alone how it was constructed.
In order to solve the bug I had to understand the code, which meant inventing a new language to talk about pipelines. Once I’d expressed the pipeline clearly, it was obvious how the pieces interacted. Experimenting with new pipelines took a half hour, and I was able to almost double throughput with a single-line change.
Hi,
I would just like to know what tool(s) you used to provide the graph visualisations in your article. If it’s something like gnuplot, then what settings were there?
Thanks